반응형
chartjs로 간단한 레이더 도형 그려보기
Create a new fiddle - JSFiddle
jsfiddle.net
를 통해 html을 시작해봅니다.
리소스에서 https://cdnjs.cloudflare.com/ajax/libs/Chart.js/2.5.0/Chart.min.js를 추가해 줍니다.
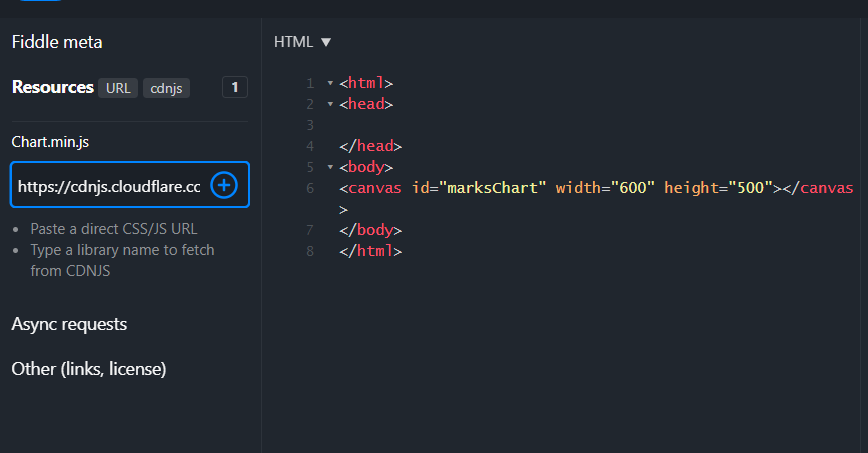
이후 HTML 칸에는
<html>
<head>

</head>
<body>
<canvas id="marksChart" width="600" height="500"></canvas>
</body>
</html>
javascript 칸에는 아래와 같이 넣어줍니다.
var marksCanvas = document.getElementById("marksChart");

Chart.defaults.global.defaultFontFamily = "Lato";
Chart.defaults.global.defaultFontSize = 18;

var marksData = {
  labels: ["행복", "HR제도", "사무환경", "윤리경영", "업무"],
  datasets: [{
    label: "전사",
    backgroundColor: "transparent",
    borderColor: "rgba(200,0,0,0.6)",
    fill: false,
    radius: 6,
    pointRadius: 6,
    pointBorderWidth: 3,
    pointBackgroundColor: "orange",
    pointBorderColor: "rgba(200,0,0,0.6)",
    pointHoverRadius: 10,
    data: [3, 4, 3.3, 3, 3]
  }, {
    label: "우리조직",
    backgroundColor: "transparent",
    borderColor: "rgba(0,0,200,0.6)",
    fill: false,
    radius: 6,
    pointRadius: 6,
    pointBorderWidth: 3,
    pointBackgroundColor: "cornflowerblue",
    pointBorderColor: "rgba(0,0,200,0.6)",
    pointHoverRadius: 10,
    data: [3.3, 3, 2.2, 3, 4]
  }]
};

var chartOptions = {
  scale: {
    gridLines: {
      color: "black",
      lineWidth: 3
    },
    angleLines: {
      display: false
    },
    ticks: {
      beginAtZero: true,
      min: 0,
      max: 5,
      stepSize: 1
    },
    pointLabels: {
      fontSize: 18,
      fontColor: "green"
    }
  },
  legend: {
    position: 'left'
  }
};

var radarChart = new Chart(marksCanvas, {
  type: 'radar',
  data: marksData,
  options: chartOptions
});
그러면 최종으로 레이더 도형이 그려짐을 알 수 있습니다.
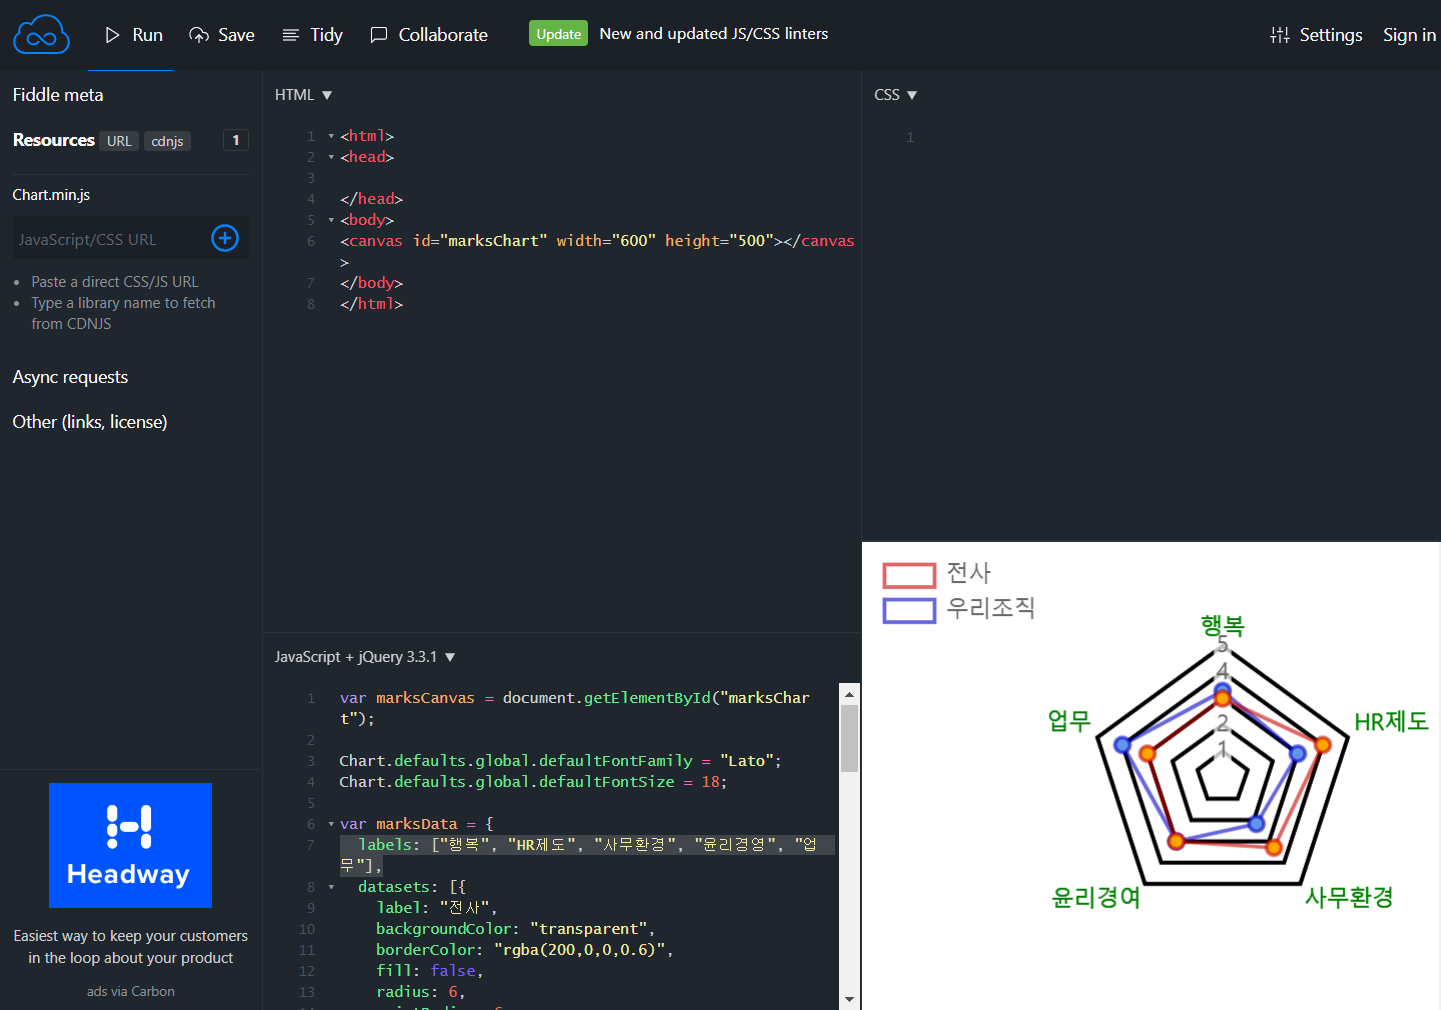
생각보다 개발하는건 쉽지가 않네요 ㅠ
728x90
'Tip & Tech > Computer' 카테고리의 다른 글
| [컴초보] 윈도우 최초 설치후 3DP로 드라이버 설치하기 (0) | 2019.11.03 |
|---|---|
| [컴초보]LG 15UD470 블루투스가 안보여요. (0) | 2019.11.01 |
| [윈도우] 윈도우 백업하기(True Image) (0) | 2019.10.23 |
| [구글포토] 무료로 원본 백업하기 (0) | 2019.10.17 |
| [타오나스] 헤놀리지 초기 패키지 설정하기(트랜스미션) (0) | 2019.10.13 |
